Production AI field guide
Your agent did not hallucinate. It called a valid tool with the wrong context, changed a live record, and left no reliable evidence explaining why. This guide shows how to prevent that operating blind spot.
AI agent observability: the fast answer
- AI agent observability is the evidence layer for agent behavior. It connects a business request to the context an agent used, the model and prompt version, each tool call, approvals, system changes, the final outcome, latency, cost, and evaluation result.
- A successful API response is not a successful agent outcome. The tool may return 200 OK while the agent updates the wrong account, uses stale data, violates a workflow rule, or solves the wrong business problem.
- One trace should represent one unit of work. Spans should show the important steps inside that work: retrieval, model turns, handoffs, guardrails, tool calls, approvals, and outcome verification.
- Do not record everything by default. Prompts, tool arguments, documents, and outputs may contain customer data, employee data, credentials, or legal material. Capture the minimum evidence needed, redact sensitive fields, and apply retention rules.
- Start with one workflow that changes enterprise state. Instrument it end to end, define five failure cases, create a replay path, and measure verified outcomes before scaling to more agents.
If an agent can change enterprise state, every action must be attributable, replayable, and measurable against its intended outcome.
That is the practical standard. Not a colorful dashboard. Not a list of token counts. Not a generic log stream. The system should let an operator answer five questions quickly: What was the agent asked to do? What evidence did it use? What did it decide and execute? What actually changed? Was the business outcome correct?
Traditional application monitoring answers whether software is available, fast, and error free. AI agent observability must also answer whether the work was appropriate, grounded, authorized, complete, and useful. That requires technical telemetry and business evidence in the same trace.
What to do this week
Choose one production or near-production agent that can create, update, route, approve, notify, deploy, refund, schedule, or escalate. Do not begin with a harmless demo chatbot. Use a workflow where a wrong action has a real operational cost.
- Write the business outcome in one sentence, such as “resolve a valid refund request within policy and update the correct account.”
- Capture a trace ID for every run and propagate it through model calls, tools, APIs, queues, databases, and human approvals.
- Record the agent version, prompt or policy version, source identifiers, tool name, action tier, approval state, result code, latency, and cost.
- Link the trace to the final business outcome, not only the agent response. Confirm whether the refund posted, the shipment changed, the ticket closed, or the deployment succeeded.
- Create five test failures: wrong entity, stale context, unauthorized tool, tool timeout, and superficially successful but incorrect outcome.
- Run the agent in shadow or approval mode until an operator can reconstruct every failure from the evidence without reading raw production data.
The deliverable at the end of the week is simple: one trace view that can explain one real task from request to verified outcome.
Why normal logs are not enough for AI agents
A conventional application follows code paths written in advance. An agent chooses among tools, sources, models, and next steps at runtime. Two runs with similar inputs can take different paths. The interesting failure is often not an exception. It is a reasonable-looking sequence that produces the wrong business result.
Consider a service agent that receives a refund request. The model identifies the customer, retrieves an order, checks policy, calls a refund tool, updates the CRM, and drafts a confirmation. Every API can respond successfully. The run can still fail if the retrieved order belongs to a different customer, the policy document is outdated, the agent selected the wrong refund reason, the approval threshold was misapplied, or the payment processor accepted a duplicate request.
Logs may show six successful calls. Observability must show whether those calls formed a correct piece of work.
Is the service running? What is the latency, error rate, throughput, and resource use?
Which steps occurred, in what order, under which parent run, and where did time or failure accumulate?
Was the response, trajectory, tool choice, action, and final outcome correct for the task?
Production teams need all three. Monitoring without traces cannot reconstruct a run. Traces without evaluation only show what happened, not whether it was good. Evaluation without production telemetry cannot explain why quality changed or which component caused the regression.
This is also where observability must remain distinct from the AI agent control plane. The control plane defines and enforces identity, permissions, policies, approvals, quotas, and model routing. The observability layer records evidence, diagnoses behavior, scores outcomes, and supports replay. One controls what may happen. The other proves what did happen and whether it worked.
The seven-part agent evidence chain
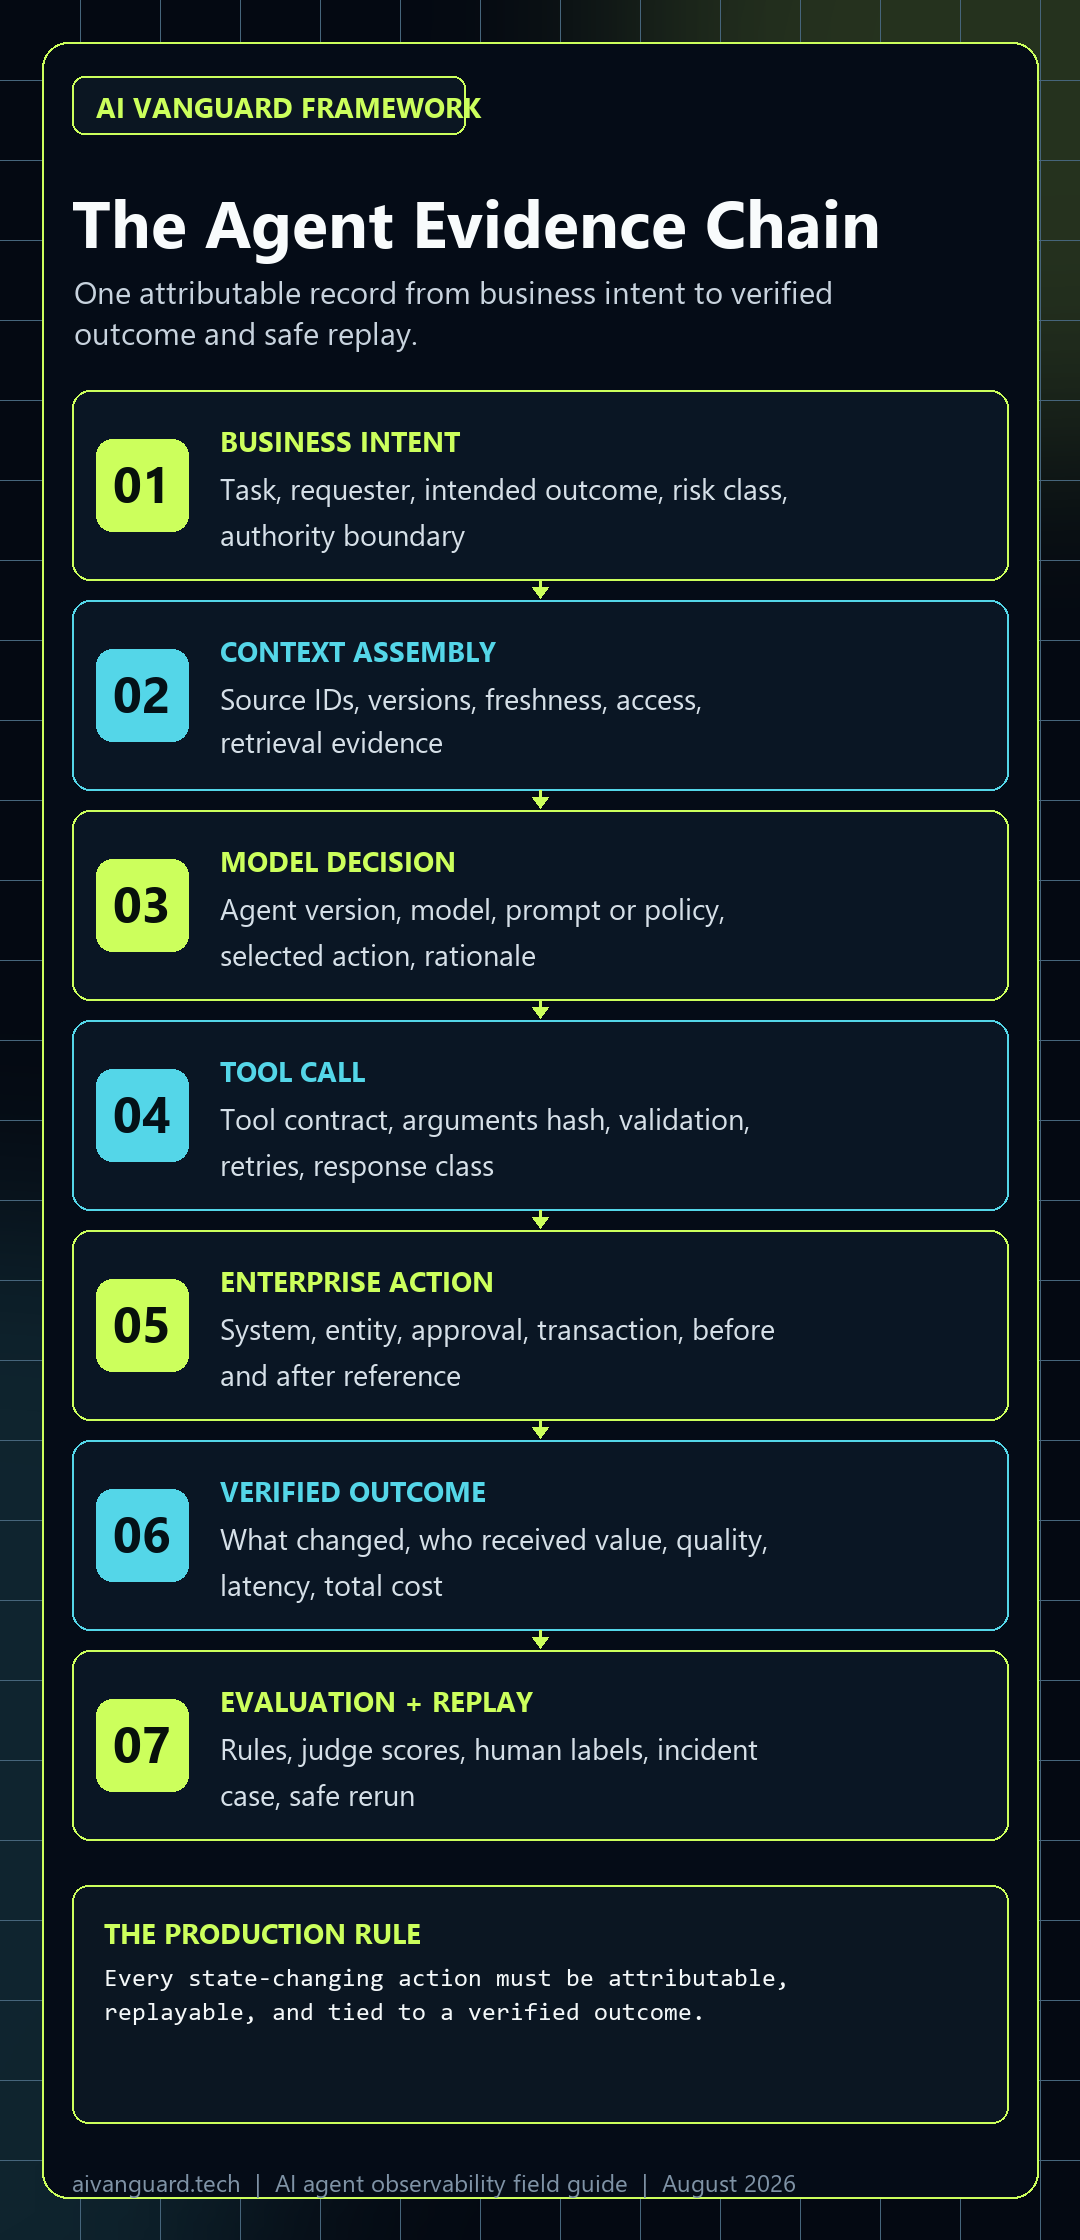
An agent trace becomes useful when it follows the logic of the business task, not merely the architecture of the code. The evidence chain below links intent to outcome through seven stages.
1. Business intent
Record the task ID, requesting actor, workflow name, intended outcome, risk class, and authority boundary. “Help the customer” is not observable. “Draft a refund recommendation for order 4812, under policy version 7, without executing payment” is observable.
2. Context assembly
Record source identifiers, retrieval query, document versions, freshness, permissions, and which pieces of context were actually passed to the model. Do not depend on a full raw prompt dump. Store hashes or stable references where sensitive content should remain in its source system.
3. Model decision
Record model provider, model name, agent version, prompt or policy version, output format, sampling settings where relevant, and the decision produced. Capture enough to compare releases. Do not treat hidden chain-of-thought as a required audit artifact. The useful evidence is the explicit decision, cited context, selected action, and structured rationale designed into the workflow.
4. Tool call
Record the tool contract, call ID, argument schema version, redacted argument summary, validation result, retries, timeout, response class, and whether the tool is read-only or state-changing. A tool name alone is not enough. Operators need to know which action was requested against which entity under which limits.
5. Enterprise action
Record the system of record, before-and-after state reference, approval identity, idempotency key, transaction ID, and rollback handle. This stage separates a recommendation from a real-world change. If the agent can write, the trace must reach the write.
6. Outcome
Verify what happened after execution. Did the customer receive the refund? Did the shipment update propagate? Did the code pass deployment checks? Did the escalation reach an owner? Outcome evidence may arrive later than the agent response, so the trace model must support delayed outcome events.
7. Evaluation and replay
Attach deterministic checks, model-based scores, human review, incident labels, and replay results. A replay should run the same case against a new agent version or policy without repeating the original side effect. That requires separating decision simulation from action execution.
The agentic data layer supplies governed context and stable business meaning. The evidence chain records how that context was used. Together they prevent a common failure: an agent makes a technically valid decision from semantically wrong or stale data.
A minimum viable trace schema
Different frameworks use different names, but the portable structure is session, trace, and span. A session groups related work over time. A trace represents one end-to-end unit of work. Spans represent meaningful operations inside the trace.
The OpenAI Agents SDK tracing documentation describes traces for workflows and spans for model generations, tool calls, handoffs, guardrails, and custom events. OpenTelemetry’s GenAI semantic conventions define common attributes for agents, conversations, operations, tool calls, data sources, token use, and evaluation scores. These standards make it possible to avoid a telemetry model locked to one framework.
Open the example trace record
{
  "trace_id": "tr_01J7K8...",
  "session_id": "case_78421",
  "workflow": "customer_refund_review",
  "environment": "production",
  "agent": {
    "id": "refund_reviewer",
    "version": "2026.08.3",
    "model": "approved-model-alias",
    "policy_version": "refund-policy-7"
  },
  "intent": {
    "requester_type": "support_user",
    "outcome": "valid recommendation for the correct order",
    "action_tier": "draft_only"
  },
  "context": {
    "sources": ["crm:customer:hash", "orders:4812", "policy:refund:7"],
    "freshness_seconds": 42,
    "content_recorded": false
  },
  "spans": [
    {"name": "retrieve order", "status": "ok", "latency_ms": 118},
    {"name": "evaluate policy", "status": "ok", "latency_ms": 641},
    {"name": "draft recommendation", "status": "ok", "latency_ms": 902}
  ],
  "outcome": {
    "verified": true,
    "quality_score": 0.94,
    "human_override": false,
    "cost_usd": 0.034,
    "latency_ms": 1812
  }
}
Use low-cardinality names for spans. “execute refund” is useful for dashboards. “execute refund for customer 739184 at 14:32” is not. Put unique IDs in attributes, where they can be filtered without turning every run into a new metric series.
Propagate the trace ID beyond the agent framework. Put it in API headers, queue messages, database audit records, approval events, and downstream job metadata. Without propagation, the trace stops at the model boundary and cannot prove what happened in the enterprise system.
Logs tell you that code ran. The evidence chain tells you whether the work was right.
The AI agent evidence contract
Before choosing a dashboard, agree on the record that every consequential run must produce. This is the smallest practical handoff between the workflow owner, engineering, security, operations, and the person accountable for the business result. It makes a trace useful when an incident happens, rather than merely available.
No write is complete until the run can name its authority, its target, its system-of-record proof, and its recovery path.
Copy the contract for your first workflow
{
  "trace_id": "unique end-to-end run ID",
  "workflow": "one named business workflow",
  "intent": "the measurable task and expected result",
  "requester_ref": "redacted user or system reference",
  "agent_version": "released agent version",
  "policy_version": "active policy or prompt contract",
  "authority_tier": "draft | approval_required | write",
  "context_refs": ["source ID and version, not raw sensitive text"],
  "target_entity_ref": "validated customer, order, account, or asset reference",
  "tool_calls": [{"tool": "name", "contract_version": "v1", "result": "ok|blocked|failed"}],
  "approval_ref": "human or policy approval reference when required",
  "system_of_record": "the system whose state matters",
  "transaction_ref": "idempotency key or transaction ID for a write",
  "outcome_proof": "independent evidence that the intended result occurred",
  "evaluation": {"entity_match": "pass|fail", "policy_check": "pass|fail", "outcome_check": "pass|fail"},
  "rollback_handle": "safe reversal, cancellation, or recovery reference",
  "retention_class": "data handling and deletion rule"
}
Download the one-page Evidence Contract (PDF)
Use the contract as a release gate
- Named authority: the trace states whether the agent was drafting, awaiting approval, or permitted to write. A tool response does not create authority.
- Validated target: a state-changing action carries the exact entity reference that passed deterministic validation. Never infer identity from a model sentence alone.
- Outcome proof: the result comes from the system of record or a defined human check, not the agent’s own completion message.
- Recovery reference: operators can identify the idempotency key, cancellation, rollback, or manual remediation path before an incident occurs.
- Data boundary: the trace carries stable references and redacted summaries by default. Raw prompts, documents, and tool arguments require an explicit need and retention rule.
OpenTelemetry provides a portable baseline for agent, model, tool, data-source, and evaluation attributes. The business fields above are the local contract that links those technical events to accountable enterprise work. Keep the names stable as frameworks and vendors change.
The golden signals for production agents
Token use, latency, and exceptions matter, but they are not enough. Measure the agent at three levels: system health, trajectory quality, and business outcome.
| Signal | Definition | Useful threshold | Operator action |
|---|---|---|---|
| Verified outcome rate | Tasks that produced the intended business result, confirmed by the system of record or a human. | Set per workflow; do not mix low-risk drafts with financial actions. | Pause rollout when outcome quality drops after a release. |
| Tool-choice accuracy | Correct tool and action selected for the case, including the choice to call no tool. | Near perfect for irreversible actions; lower only in shadow mode. | Review context, tool descriptions, and action policy. |
| Entity accuracy | Action applied to the correct customer, order, shipment, account, repository, or record. | 100 percent for state-changing actions. | Block writes when entity confidence or validation fails. |
| Evidence completeness | Runs with actor, version, context references, tool evidence, approval, outcome, and evaluation. | 100 percent for production writes. | Reject or quarantine incomplete traces. |
| Human override rate | Recommendations changed, rejected, or escalated by reviewers. | Track by reason and agent version, not as one vanity average. | Turn common override reasons into tests and policy changes. |
| Recovery rate | Failed runs restored safely without duplicate or orphaned side effects. | 100 percent for workflows claiming recoverability. | Test idempotency, rollback, timeout, and retry behavior. |
| Cost per verified outcome | Total model, tool, infrastructure, and review cost divided by verified successful outcomes. | Below the value or avoidable human cost of the workflow. | Reduce unnecessary turns, retrieval, and review burden. |
| Tail latency | 95th and 99th percentile completion time, including tool waits and approvals. | Based on customer or operator service level, not model latency alone. | Inspect slow spans, retries, queues, and human gates. |
| Evaluator disagreement | Cases where deterministic checks, model judges, and humans reach different conclusions. | Investigate any rising trend or high-risk disagreement. | Calibrate evaluators against labeled examples. |
The financial measurement belongs with the AI agent ROI framework. Observability supplies the trace-level facts that make ROI credible: cost by run, review time, failure cost, recovery cost, and verified outcome. Without those facts, agent ROI becomes an estimate based on activity rather than results.
Seven failures your dashboard must reveal
The reasoning appears sound, but the action targets the wrong customer, order, account, or environment. Detect with deterministic entity validation before writes.
The agent uses an old policy, document, price, inventory state, or account status. Record source version and freshness in the trace.
The agent calls a powerful action tool when a lookup, draft, clarification, or escalation was appropriate. Score both chosen and rejected tools.
The agent attempts an action outside its identity or user-delegated authority. Correlate denial events with the control plane and workflow design.
One step succeeds and another fails, leaving inconsistent systems. Trace side effects individually and verify final state across all affected systems.
The agent repeats retrieval, model turns, handoffs, or tool calls without progress. Track step count, repeated-call patterns, budget, and stop reason.
The agent reports completion because a tool returned successfully, but the intended business result never occurred. Require delayed outcome verification.
An automated judge gives high scores to outputs humans increasingly reject. Track judge version, calibration set, disagreement, and review samples.
The existing guide to AI agent runtime controls and insider risk explains how to prevent unsafe execution. Observability closes the loop after and during execution by showing which controls fired, which failed, and which new failure pattern should become a control.
The incident replay workflow
When an agent fails, the goal is not to read every log line. The goal is to reconstruct the smallest causal chain, protect the business, convert the failure into a test, and prove the fix without repeating the side effect.
Contain
Stop or downgrade the affected workflow. Revoke the agent token, disable the tool, force approval mode, or route work to humans. Preserve the trace before changing configuration.
Reconstruct
Read the trace from intent to outcome. Identify the first incorrect assumption or action, not merely the last visible error. Compare context, versions, policies, and tool responses.
Classify
Label the failure: context, model decision, tool contract, permission, integration, approval, outcome verification, or evaluator. A stable taxonomy makes recurring patterns visible.
Convert to a test
Sanitize the case and add it to the regression dataset. Define the expected tool choice, forbidden actions, outcome, and score. Include nearby edge cases, not only the exact incident.
Replay safely
Run the trace against the candidate agent in simulation or a sandbox. Replace state-changing tools with recorded responses or dry-run contracts. Confirm that no production side effect can occur.
Release with a watch
Deploy to a small traffic slice, attach an alert to the failure signature, and compare outcome, override, cost, and latency metrics against the previous version.
A good incident system reduces mean time to explanation, not only mean time to recovery. Recovery restores service. Explanation prevents the same class of failure from returning under a different prompt or tool.
Worked example: prevent a false success before it refunds the wrong order
This is a worked example, not a customer case study. It shows how an evidence contract changes the response to a common enterprise failure: every API call succeeds, but the business result is wrong.
A support agent receives a request to refund an order. It retrieves a customer record, selects an order, checks the policy, calls the payment processor, updates the CRM, and drafts a confirmation. The trace looks healthy. The processor returns 200 OK. But the customer reference matches two records and the agent refunds an earlier order.
Build three checks before write mode
- Entity check: compare the customer, order, currency, and payment reference across the CRM, order system, and payment processor. Any mismatch forces approval mode.
- Policy check: record the policy version and deterministic eligibility result. The model can summarize policy; it should not silently replace the rule engine.
- Outcome check: do not mark the task successful until the payment processor refund ID, CRM event, and correct order reference are linked to the original trace.
When the outcome check fails
Contain the workflow first. Disable autonomous writes for that action tier, preserve the trace, and switch the workflow back to approval mode. Then use the trace to isolate the first bad link: ambiguous entity selection, stale CRM data, missing payment reference, or a faulty tool contract.
Next, sanitize the case into a regression test. The expected result is not simply “refund rejected.” It is: select no order when the identity evidence is ambiguous; request clarification or approval; do not call the payment tool; and leave every system unchanged. Replay that test against the repaired agent with the payment tool replaced by a dry-run contract. Only restore write mode after the entity, policy, and outcome checks pass together.
The operational win is not a prettier trace. It is stopping a technically successful mistake before it becomes a customer and finance incident.
How to build an evaluation loop that reflects real work
Evaluation should cover the full trajectory. A polished final answer can hide a poor retrieval step, an unnecessary tool call, a policy violation, or an expensive loop. Score the decision path and the outcome separately.
Validate schemas, required fields, entity match, policy version, allowed tools, approval state, response codes, idempotency, and final system state. Use code when the rule is objective.
Maintain labeled examples from real work: normal cases, edge cases, prior incidents, adversarial inputs, missing context, and ambiguous requests. Version the dataset.
Use a judge for qualities such as completeness, grounding, relevance, or escalation judgment. Require a rubric, record the judge version, and calibrate against human labels.
Sample production traces by risk, novelty, disagreement, and low confidence. Reviewers should label why they changed an outcome, not only approve or reject it.
Run evaluations at four moments. Before release, run the regression dataset. During rollout, compare the new version against the current version in shadow mode. In production, score a sample of live traces and all high-risk actions. After an incident, add the sanitized case to the test set and replay it before reopening autonomy.
Do not optimize a single quality score. A version can become more accurate but slower, more expensive, less willing to escalate, or more likely to call tools. Use a release scorecard that includes outcome quality, forbidden-action rate, tool-choice accuracy, human override, cost, tail latency, and recovery.
The broader agentic enterprise operating system needs memory, orchestration, governance, and evaluation. This guide provides the evidence contract that connects those layers instead of leaving each platform with isolated dashboards.
A tool-neutral production architecture
Use open trace propagation as the spine. Instrument the agent framework, but do not stop there. Export traces through an OpenTelemetry-compatible path, enrich them with business metadata, route sensitive content according to policy, and join technical traces to outcome events from enterprise systems.
| Layer | What it captures | Design rule |
|---|---|---|
| Agent framework | Agent run, model turns, handoffs, guardrails, tool requests, and final response. | Use automatic tracing, then add custom spans only for business-significant steps. |
| Open telemetry pipeline | Trace and span IDs, timing, status, attributes, events, metrics, and export routing. | Keep names portable and use a collector so backends can change without rewriting the agent. |
| Enterprise systems | API calls, queues, database changes, approvals, transactions, and downstream jobs. | Propagate the trace ID and record the before-and-after state reference. |
| Evaluation service | Rules, model judges, human labels, test datasets, release comparisons, and incident cases. | Version evaluators and keep raw labels separate from aggregate scores. |
| Outcome store | Resolution, revenue, refund, shipment, deployment, case closure, customer response, or other business result. | Attach delayed outcomes to the original trace instead of creating an unrelated analytics event. |
| Operations view | Alerts, trace search, dashboards, failure cohorts, release comparisons, and incident replay. | Organize views around workflows and outcomes, not only models and endpoints. |
Current official platforms increasingly follow this shape. Microsoft Foundry uses tracing to capture latency, exceptions, prompts, retrieval, ordered actions, and tool calls, with OpenTelemetry and Application Insights underneath. Amazon Bedrock AgentCore Observability exposes traces, workflow steps, intermediate outputs, latency, token use, errors, and OpenTelemetry-compatible data in CloudWatch.
Agent-focused observability products can add trace graphs, prompt/version comparison, datasets, evaluators, and human annotation. Langfuse’s trace guidance, for example, recommends one self-contained unit of work per trace, meaningful nesting, stable names, business metadata, environments, and sessions for related traces. The principle matters more than the vendor: the trace structure must survive a tool change.
A practical 30-day implementation plan
Select one workflow. Define intended outcome, owner, action tier, systems touched, forbidden actions, approval rules, and the minimum evidence required for each run.
Add trace propagation to agent, model, retrieval, tool, API, queue, approval, and outcome events. Redact sensitive content and set retention by data class.
Implement deterministic checks and baseline outcome, tool accuracy, entity accuracy, override, latency, cost, and evidence completeness.
Build at least 25 cases covering normal work, stale context, wrong entities, tool errors, duplicate actions, policy edges, ambiguous requests, and past incidents.
Run on live inputs without autonomous writes. Compare agent recommendations with human decisions. Replay failures against candidate fixes in a sandbox.
Release a small slice with approval gates, alerts, budget limits, and a named incident owner. Expand only when verified outcomes and recovery tests meet the threshold.
The day-30 exit criteria
- Every run has a trace ID that reaches the system of record.
- Every write identifies agent, requester, policy version, tool, approval, transaction, and rollback reference.
- Every production outcome can be verified independently from the agent’s own completion message.
- Five known failure classes trigger an alert, block, escalation, or explicit low score.
- A failed case can be replayed without repeating a real-world side effect.
- Operators can compare agent versions by verified outcome, override, cost, and tail latency.
- Prompt and tool content follow a documented redaction and retention policy.
Only after those criteria are met should the team expand autonomy or add more workflows. The strongest enterprise AI agent use cases are not the ones with the most impressive demos. They are the ones where the outcome can be proven and failure can be contained.
The vendor and architecture checklist
Do not buy an observability product because the trace graph looks attractive. Test whether it can support your operating model, data boundary, and incident workflow.
Run a proof with your hardest workflow, not a vendor-provided chatbot. Bring ten normal cases, ten edge cases, and five sanitized incidents. Require the vendor to reconstruct a failure, show the sensitive-data boundary, compare two releases, and calculate cost per verified outcome.
What leaders should ask in the operating review
Executives do not need to inspect span trees every week. They need an operating view that translates evidence into decisions.
How many tasks produced verified business results? Which workflows improved, regressed, or remain unverified?
Which actions were blocked, escalated, overridden, rolled back, or executed with incomplete evidence?
What are the top human override reasons? Which evaluator disagreements reveal a blind spot?
What is cost per verified outcome, including model use, tool calls, infrastructure, review, and recovery?
Which release, prompt, policy, model, tool, or data-source change explains this week’s movement?
Which workflow can gain more autonomy, which needs redesign, and which should be stopped?
The dashboard should make those questions answerable in minutes. If leadership only sees number of agents, number of conversations, token volume, and average latency, the organization is measuring activity while the real operational risk remains hidden.
An agent that cannot explain its action path is not autonomous. It is ungoverned.
Primary sources and implementation references
- OpenAI Agents SDK: Tracing – trace and span structure, model turns, tool calls, handoffs, guardrails, custom processors, and sensitive-data controls.
- OpenTelemetry GenAI semantic conventions – common agent, conversation, operation, data-source, tool-call, usage, and evaluation attributes.
- Microsoft Foundry: Agent tracing overview – OpenTelemetry-based agent tracing, production behavior, privacy, and multi-agent context.
- Microsoft Foundry: Set up tracing for AI agents – server-side and client-side instrumentation with Application Insights.
- Amazon Bedrock AgentCore Observability – OpenTelemetry-compatible traces, metrics, workflow visualization, errors, latency, token use, and CloudWatch integration.
- Langfuse: What a good trace looks like – trace scope, nesting, naming, metadata, environments, sessions, and evaluation context.
Frequently asked questions
What is AI agent observability?
AI agent observability is the ability to reconstruct and evaluate an agent’s end-to-end work from business intent through context, model decisions, tool calls, enterprise actions, and verified outcomes. It combines traces, spans, logs, metrics, evaluations, and business evidence.
How is AI agent observability different from monitoring?
Monitoring shows aggregate health such as availability, latency, error rates, throughput, and cost. Observability lets an operator explain a specific run, including why the agent chose a path, which context and tools it used, what changed, and whether the final outcome was correct.
What should an AI agent trace contain?
A production trace should contain the task and requester, agent and policy versions, context source references, model and tool spans, validation and approval events, system transaction identifiers, errors and retries, latency and cost, outcome verification, and evaluation results. Sensitive content should be minimized or redacted.
What is an AI agent evidence contract?
An AI agent evidence contract is the minimum record a consequential run must produce: intent, authority tier, versions, context references, target entity, tool evidence, approval, system-of-record outcome proof, evaluation, recovery reference, and retention rule. It turns traces into an operational accountability record.
Should prompts and tool arguments be stored in traces?
Only when necessary and permitted. Prompts, outputs, retrieved documents, and tool arguments can contain personal, confidential, regulated, or credential data. Prefer stable source references, hashes, redaction, field allowlists, access controls, and retention rules. Record enough evidence to diagnose the run without copying every sensitive value.
Which metrics matter most for production AI agents?
Start with verified outcome rate, tool-choice accuracy, entity accuracy, evidence completeness, human override rate, forbidden-action attempts, recovery rate, cost per verified outcome, tail latency, and evaluator disagreement. Measure by workflow and risk class.
What is the difference between an AI agent control plane and observability?
The control plane defines and enforces what an agent may do through identity, permissions, policies, approvals, quotas, and routing. Observability records what the agent did, why the path occurred, what outcome followed, and whether the run met quality, safety, cost, and performance expectations.
How can a team start AI agent observability in one day?
Choose one state-changing workflow, define its intended outcome and authority tier, propagate one trace ID through the agent and systems of record, record the evidence contract, create an entity-mismatch test, and require independent outcome proof. Keep the agent in shadow or approval mode until operators can replay a failure without repeating the side effect.
How long does it take to implement AI agent observability?
A focused team can instrument one bounded workflow, create a minimum trace contract, define failure cases, build a scorecard, and run a controlled release in about 30 days. Enterprise-wide coverage takes longer because systems, data classes, workflows, and risk thresholds differ.
Build evidence before autonomy
The next generation of enterprise agents will be judged less by how human their responses sound and more by whether their work can be trusted, explained, measured, and recovered. Start with one consequential workflow. Give every run an evidence chain. Verify the outcome outside the agent. Turn every incident into a replayable test.
Then connect that evidence to the control plane, runtime controls, ROI model, and workflow portfolio. That is how agents move from impressive demos to accountable operations.
Research Path